
This guest post on Lab Notes comes from Samantha Breslin, Senior Project Coordinator at City Health Dashboard.
The impact of housing on health is well documented, with a significant body of research that demonstrates the ways that housing influences individual and community health through the pathways of housing affordability, stability, quality, and neighborhood conditions. By examining local community health data, housing officials can further explore these connections in order to develop more comprehensive housing strategies that support healthy communities.
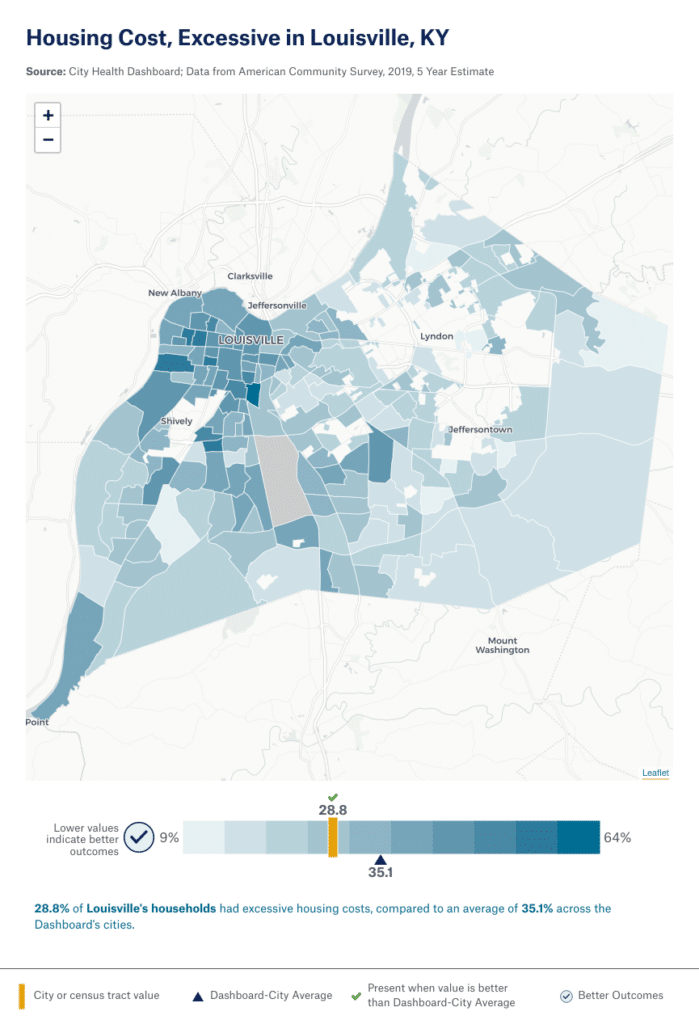
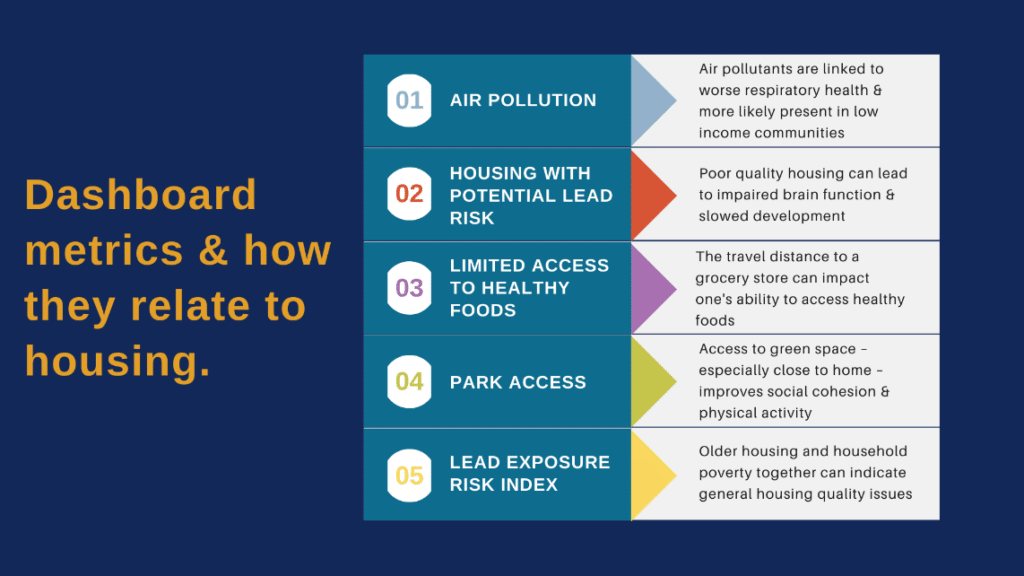
The City Health Dashboard provides a robust resource that housing stakeholders can use to begin examining important local health data. Launched in 2018, this free, online tool provides city- and neighborhood-level data on 40+ measures of health and the drivers of health for U.S. cities with 50,000 or more residents. The Dashboard includes measures that shed light on how housing cost, quality, and other neighborhood factors influence community health, including excessive housing costs, housing with potential lead risk, air pollution, park access, walkability, and access to healthy food. The Dashboard also provides key health outcome measures that provide a snapshot of the overall health and well-being of residents in a locality through measures such as life expectancy and premature death.
While housing officials do not need to become experts in health, understanding key local health measures can help cities consider the potential impacts of their housing strategies on community health behaviors and outcomes. For example, it is important to consider not only the number of affordable units in a housing plan, but where they are located in relation to healthy foods and parks, given the disproportionate impact of health issues such as obesity and diabetes on residents with low incomes. As housing officials work to develop affordable housing, they may consider engaging with local health department colleagues to identify potential opportunities for expanding housing access in ways that also promote access to health-supportive environments.
Local success stories
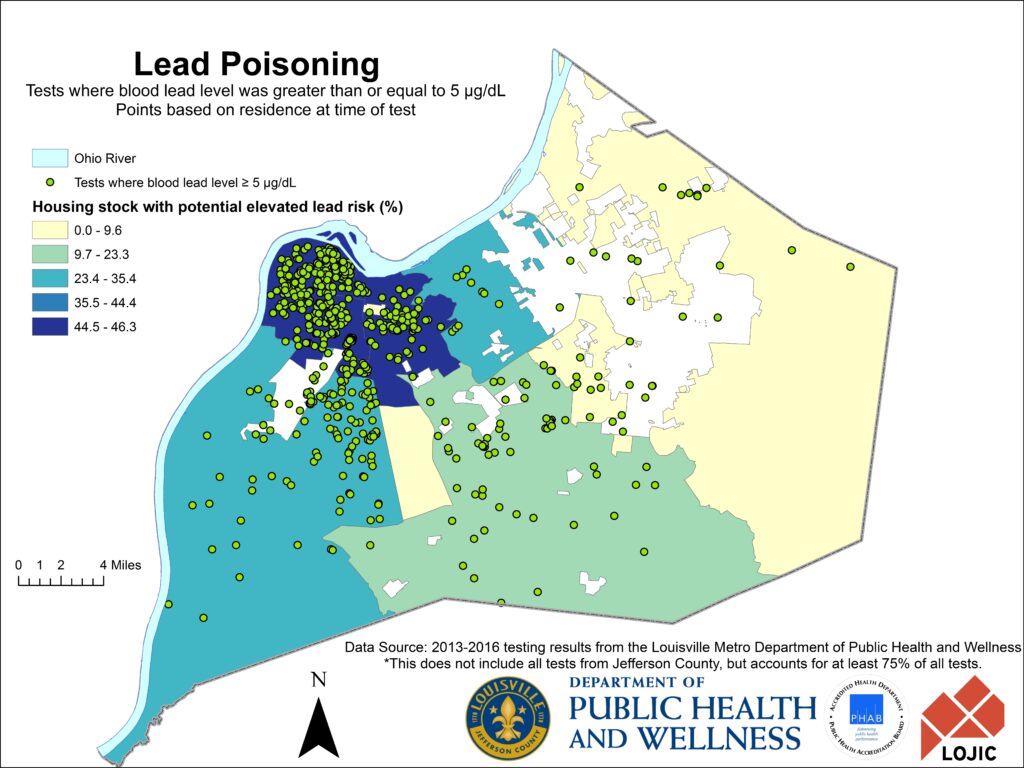
Communities across the country are already using Dashboard data to inform innovative housing solutions. In Louisville, KY, the Center for Health Equity integrated the Dashboard’s data on housing with potential lead risk with locally-collected data on blood lead testing, revealing that the Louisville neighborhoods where lead risk is particularly elevated were the same neighborhoods with more children testing positive for high levels of lead (≥5µg/dL). These insights are driving community and government partnerships to increase testing, raise awareness, and strengthen local enforcement of housing codes to support healthier and safer housing, particularly in high-risk neighborhoods.
In Grand Rapids, MI, Invest Health, a national cross-sectoral initiative, used the Dashboard’s income inequality, unemployment, and life expectancy metrics to identify 17 census tracts across the city, locally known as “Neighborhoods of Focus,” with significant economic needs and health disparities. The Grand Rapids team used the data to apply for and receive over $50 million worth of low-income housing tax credits, and to secure funding to preserve and build more affordable housing units in the Neighborhoods of Focus.
Getting started in your community
To begin examining local data in your community, simply enter your city and state on the Dashboard’s homepage to explore the metrics. Select a single metric or generate a high-level snapshot of your community from your City Overview page. For technical assistance with applying health data to your housing strategies, contact info@cityhealthdashboard.com.