
Understanding eviction patterns at the local level is an important priority for housing advocates, researchers, and policymakers, especially as pandemic-era eviction protections have phased out in cities across the state. To help in that process, the Housing Solutions Lab is pleased to announce a new research tool: the New York State Eviction Tracker.
Using data from the New York State Office of Court Administration, the tracker aggregates information on all cases in which a landlord has formally filed to evict a tenant and warrants for eviction issued or executed by the courts. Eviction data at the ZIP Code level is publicly available and released on a monthly basis for each city in New York State, in addition to Nassau and Suffolk counties. The NYU Furman Center also offers a tracker for eviction filings and warrants in New York City.
There are several limitations to the available data aggregated by the tracker. While the data includes eviction cases from all city courts in New York State as well as the county courts in Nassau and Suffolk counties, it does not include eviction cases filed in other courts (such as upstate county courts) against tenants who live in rural areas, towns, or villages. The geographies included in the tracker cover approximately 53 percent of New York State’s renter households living outside of New York City. An additional limitation is that the data does not capture instances in which a tenant may be asked or coerced to leave by a landlord without a formal court process.
Eviction Filings
The tracker displays the cumulative count of eviction filings in each ZIP Code with available data and monthly filing trends in the years 2020, 2021, and 2022, compared to a pre-pandemic average (2017-2019). Filings can also be filtered by whether the case is a non-payment case (cases arising due to the non-payment of rent) or a holdover case (cases arising due to some other issue, such as a lease violation). Data on the median amount of money sought in non-payment cases is also displayed for each year since 2020 in addition to the pre-pandemic average.
Research has shown that evictions are associated with negative consequences for tenants who experience them, including increased risk of homelessness and housing instability and negative impacts on earnings and health. Even when eviction cases do not end in an executed warrant, an eviction filing can still be a stressful event and marks the beginning of a legal process that may still result in other types of settlements or judgments against the tenant. Because there are many points at which a tenant may lose their housing after an eviction filing, including through executed warrants, tracking trends in filings can provide insights into potential patterns of housing instability within a jurisdiction.
Warrants of Eviction
Even if a court has already ruled in favor of a building owner, an eviction warrant is necessary for that owner to retake possession of an apartment and remove a tenant and their belongings.Once issued, a landlord still must request a sheriff or marshal to execute the warrant. The tracker presents information on all outstanding eviction warrants that have been issued but not executed and all executed warrants since 2020. ZIP Code level maps provide another layer of detail about where relatively greater numbers of warrants are issued and executed within jurisdictions. Because of the time it takes for a case to progress through the court system, warrants may be executed and reported several months after the initial filing.
Identifying Filing Trends in New York State Cities
Eviction filing activity has varied across New York State jurisdictions since the end of the state eviction moratorium in January 2022. In 8 of the 63 jurisdictions included in the tracker, eviction filings remained below pre-pandemic levels in each month between January and August 2022. In all other jurisdictions in the tracker, eviction filings surpassed pre-pandemic levels in at least one month between January and August 2022, with some jurisdictions seeing a particularly sharp spike in filings in the spring immediately following the end of the moratorium.
Tables 1 and 2 compare pre-pandemic eviction filing trends with 2022 trends, demonstrating the variation in filings across jurisdictions. Table 1 compareseviction filings in March and August of 2022 to the pre-pandemic averagein those months for several cities where filings remain below pre-pandemic averages. For example, in Albany, the number of eviction filings in March of 2022 was 66 percent of the pre-pandemic average number of filings for March of 2017, 2018, and 2019. In August, Albany filings remained at 59 percent of that month’s pre-pandemic average number of filings.
Table 1: Number of Eviction Filings in March and August of 2022 as a Share of Pre-Pandemic (2017-2019 Average) Filings for That Month
| March 2022 | August 2022 | |
| Albany | 66% | 59% |
| Troy | 57% | 87% |
| Kingston | 59% | 48% |
| Nassau County | 68% | 61% |
Figure 1: Monthly Eviction Filings in Albany for Non-payment Cases
Long-term filling trends during the pandemic compared to a pre-pandemic average (2017-2019).
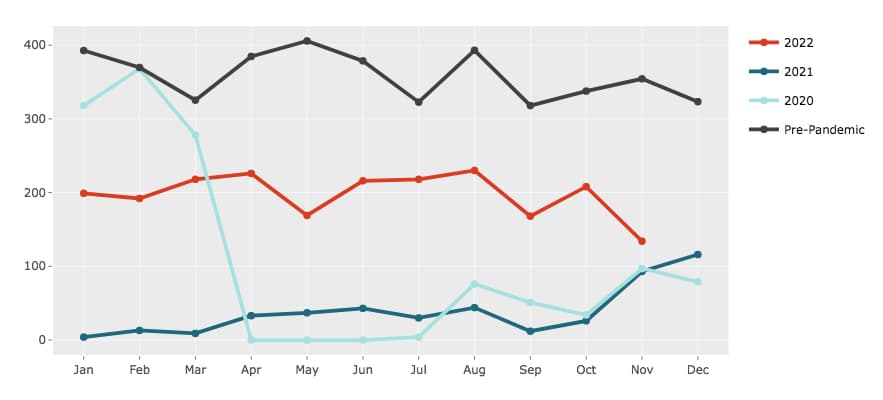
ALT Text: Figure 1 is a screenshot from the New York State Eviction Tracker for non-payment eviction filings in Albany, showing filing levels in 2022 below pre-pandemic averages.
Table 2 compares levels of eviction filings for four example jurisdictions where the number of eviction filings exceeded pre-pandemic averages after the moratorium expired in January 2022. Some of these jurisdictions saw a spike in eviction filings in the spring of 2022, but levels declined again during the summer to levels near or below pre-pandemic averages. For example, the number of eviction filings in Buffalo in March of 2022 was 152 percent of the pre-pandemic average number of filings for March. In August, Buffalo filings were at 84 percent of pre-pandemic averages for August.
Table 2: Number of Eviction Filings in March and August of 2022 as a Share of Pre-pandemic (2017-2019 Average) Filings for That Month
| March 2022 | August 2022 | |
| Buffalo | 152% | 84% |
| Rochester | 109% | 92% |
| Schenectady | 100% | 46% |
| Suffolk County | 110% | 55% |
Figure 2: Monthly Eviction Filings in Buffalo for Non-Payment Cases
Long-term filling trends during the pandemic compared to a pre-pandemic average (2017-2019).
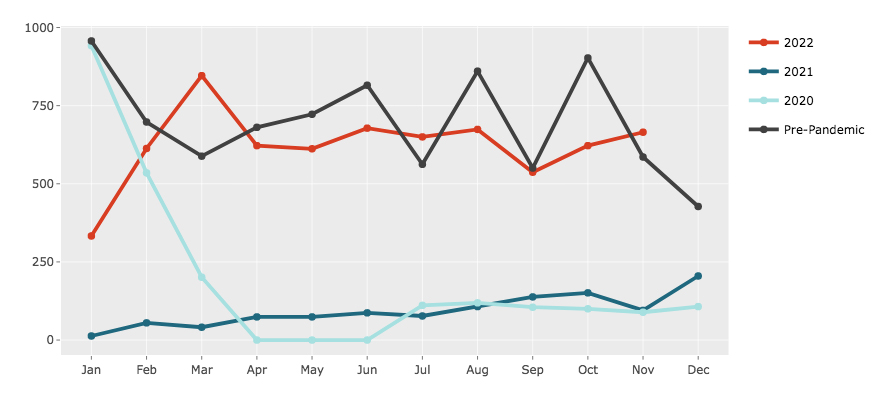
Alt Text: Figure 2 is a screenshot from the New York State Eviction Tracker for non-payment eviction filings in Buffalo showing the spike in filings in March of 2022.
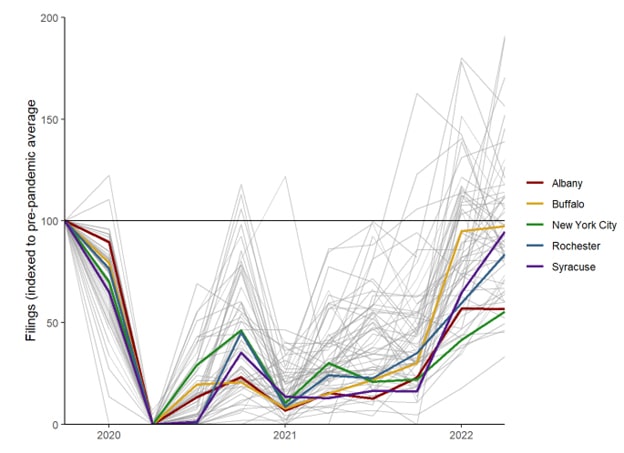
Figure 3 compares quarterly filing trends for all geographies covered in the tracker to show overall patterns across cities, indexed to a pre-pandemic average. The figure shows a general upward trend in filing activity in late 2021 and 2022, with filings in many cities approaching or exceeding pre-pandemic levels. Note that the total numbers of filings in lower-population cities in New York State are low, which affects the magnitude of quarterly changes (some of the sharp increases and decreases in filings are in cities with very low numbers of total filings).
Overall trends in quarterly filings are fairly similar in New York City and other large upstate cities, including Albany, Buffalo, Rochester, and Syracuse. While New York City saw a sharper increase in filings in 2020 after the initial dropoff at the onset of the pandemic, New York City filings have increased more slowly in the second half of 2021 and 2022 than those in cities such as Buffalo, Rochester, and Syracuse. Filing levels in New York City and Albany remain further below pre-pandemic averages than Buffalo, Rochester, and Syracuse. Comparing these trends at quarterly rather than monthly intervals averages out the one-month spikes seen in some cities, such as the March 2022 spike in Buffalo shown in Figure 2.
Figure 3: Quarterly Filing Trends Across All Geographies
The examples shown in the figures above demonstrate the benefits of data tracking tools for understanding housing instability in New York’s small and midsize cities. The ability to sort and compare data, to display it in an easy-to-read format, and to discern patterns give local policy makers a detailed picture of eviction filings in their juridicitions, as well as comparison points among similar places.
As city economies, housing submarkets, and local protections for tenants facing evictions continue to shift, the New York State Eviction Tracker will allow stakeholders and policymakers to follow eviction outcomes closely with reliable and timely data.
6 Responses